ACL2020: General Conference Statistics
There is just over one month to go before ACL 2020 (July 5-10)! We recently announced the list of accepted papers and wanted to start sharing some statistics around submissions, reviews and other interesting topics over the next month. In this blog post we focus on acceptance rates for ACL2020, comparison of rates with prior ACLs, track acceptance rates, and finally some statistics by country. We also encourage readers to read prior ACL statistics blogs, in particular the one for ACL 2019.
1. General Statistics
ACL2020 had an acceptance rate of 22.7% based on 3,429 submissions and 779 accepted papers. 3,429 is a record number of submissions for ACL. To put that number in perspective, just two years ago the number of submissions was 1,544, or less than half of this year! Ten years ago, there were “only” 956 submissions.
Of the 779 accepted papers, 571 were long papers and 208 were short papers. Note that when Desk Rejects and Withdrawals are removed, 29 and 312 papers respectively, the acceptance rate is 25.2%.
| Total Submissions | Accepted | % Accepted | |
|---|---|---|---|
| Total | 3429 | 779 | 22.7% |
| Long | 2244 | 571 | 25.4% |
| Short | 1185 | 208 | 17.6% |
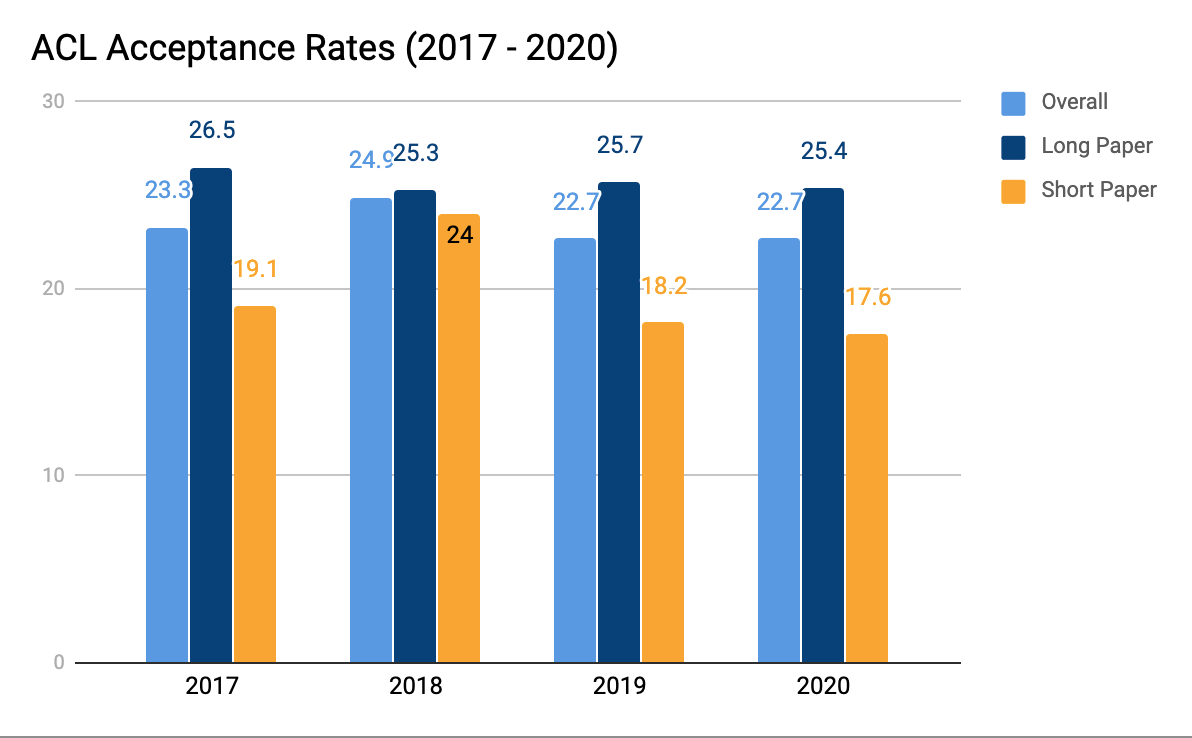
2. Comparison with Prior ACLs
This year’s ACL is in line with acceptance rates with the most recent editions of the ACL. ACL 2019 also had an acceptance rate of 22.7% with similar rates for long and short papers. For a history of acceptance rates at the ACL, please visit the ACL Wiki.
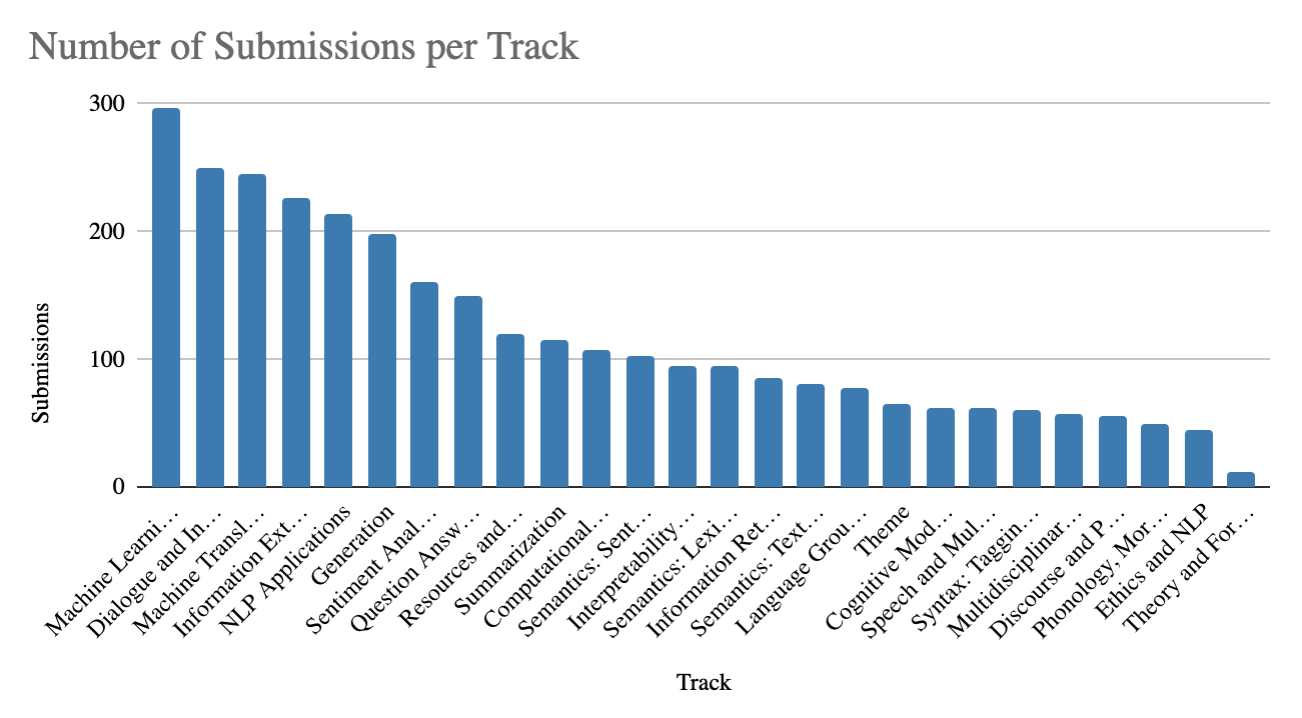
3. Track Statistics
Next, we break up the acceptance rate by track. Machine Learning for NLP, Dialogue and Interactive Technologies, Machine Translation, Information Extraction and NLP Applications were the top five most popular tracks, with each having over 200 submissions. Machine Learning for NLP had nearly 300 submissions (296). To show how much our field has grown, ACL 2002 received 258 submissions total across all tracks.
Acceptance rates for each track ranged from 17.9% to 41.7% as follows.
| Track | Submissions | Accepted | % Accepted |
|---|---|---|---|
| Cognitive Modeling and Psycholinguistics | 62 | 13 | 21.0 |
| Computational Social Science and Social Media | 108 | 23 | 21.3 |
| Desk Reject or Withdrawn | 341 | 0 | 0 |
| Dialogue and Interactive Systems | 250 | 62 | 24.8 |
| Discourse and Pragmatics | 56 | 10 | 17.9 |
| Ethics and NLP | 44 | 13 | 29.5 |
| Generation | 198 | 49 | 24.7 |
| Information Extraction | 227 | 52 | 22.9 |
| Information Retrieval and Text Mining | 86 | 20 | 23.3 |
| Interpretability and Analysis of Models for NLP | 95 | 29 | 30.5 |
| Language Grounding to Vision, Robotics and Beyond | 77 | 19 | 24.7 |
| Machine Learning for NLP | 296 | 67 | 22.6 |
| Machine Translation | 245 | 68 | 27.8 |
| Multidisciplinary and Area Chair COI | 58 | 19 | 32.8 |
| NLP Applications | 213 | 48 | 22.5 |
| Phonology, Morphology and Word Segmentation | 49 | 15 | 30.6 |
| Question Answering | 150 | 33 | 22.0 |
| Resources and Evaluation | 120 | 42 | 35.0 |
| Semantics: Lexical | 95 | 17 | 17.9 |
| Semantics: Sentence Level | 103 | 29 | 28.2 |
| Semantics: Textual Inference and Other Areas of Semantics | 81 | 24 | 29.6 |
| Sentiment Analysis, Stylistic Analysis, and Argument Mining | 161 | 33 | 20.5 |
| Speech and Multimodality | 62 | 16 | 25.8 |
| Summarization | 115 | 30 | 26.1 |
| Syntax: Tagging, Chunking and Parsing | 60 | 16 | 26.7 |
| Theme | 65 | 24 | 36.9 |
| Theory and Formalism in NLP (Linguistic and Mathematical) | 12 | 5 | 41.7 |
| Total | 3429 | 779 | 22.7 |
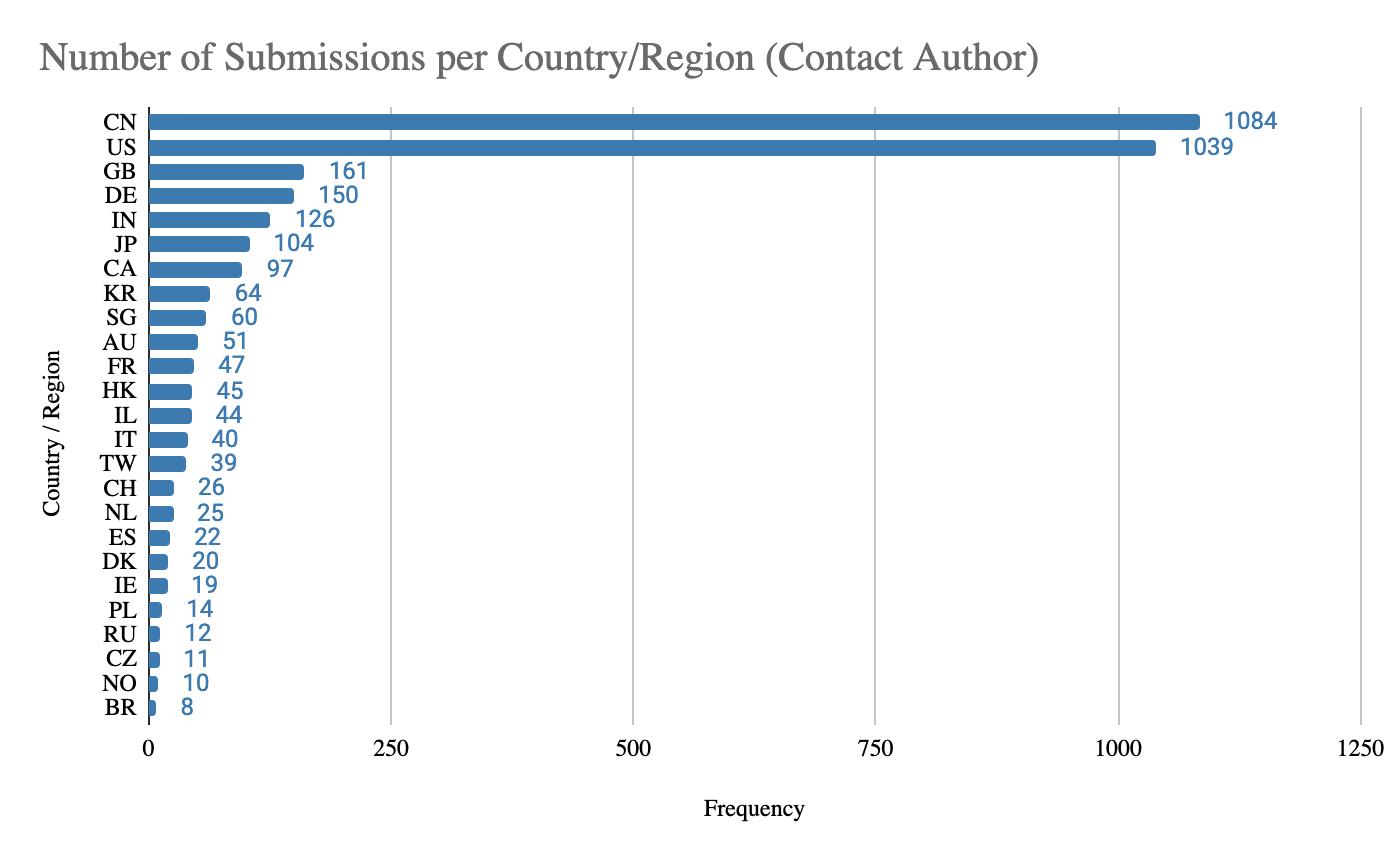
4. Country and Region Statistics
We follow ACL 2019 in extracting the country/region listed in Softconf by the contact author and calculating statistics on that set. Please note that the country/region data is self-reported by each author. There are 57 countries/regions represented in this subset. Below we list the 25 countries/regions with the most submissions. China led with 1,084, followed closely by the United States. In ACL 2019, the United States had 820 submissions and China had 817. Germany had the third most submissions then with 136.
Finally, we analyze the acceptance rates for each country/region, again based on contact author. The following table lists all 57 countries/regions in alphabetical order. In the end, 37 countries/regions have papers in the conference. The five with the most accepted papers were the US (305), China (185), Great Britain (50), Germany (44), and Japan (24). As observed by the ACL2019 Program Chairs, the distribution is too skewed for a fair comparison of acceptance rates. As in their analysis, if we consider the top 15 countries/regions in terms of number of submissions, those with the highest acceptance rates were Israel (40.9%), Great Britain (31.1%), United States (29.4%), Germany (29.3%), and a tie between Hong Kong and Singapore, both with 26.7%. This list is almost the same as last year, except Great Britain was not in the top five.
| Country/Region | Code | Count | Accepted | % Accepted |
|---|---|---|---|---|
| Argentina | AR | 1 | 0 | 0 |
| Australia | AU | 51 | 12 | 23.5 |
| Austria | AT | 4 | 0 | 0 |
| Bangladesh | BD | 4 | 0 | 0 |
| Belgium | BE | 6 | 1 | 16.7 |
| Brazil | BR | 8 | 1 | 12.5 |
| Bulgaria | BG | 2 | 1 | 50 |
| Canada | CA | 97 | 15 | 15.5 |
| China | CN | 1084 | 185 | 17.1 |
| Croatia | HR | 3 | 1 | 33.3 |
| Czech Republic | CZ | 11 | 1 | 9.1 |
| Denmark | DK | 20 | 6 | 30 |
| Egypt | EG | 4 | 0 | 0 |
| Estonia | EE | 1 | 0 | 0 |
| Finland | FI | 2 | 0 | 0 |
| France | FR | 47 | 10 | 21.3 |
| Germany | DE | 150 | 44 | 29.3 |
| Great Britain | GB | 161 | 50 | 31.1 |
| Greece | GR | 5 | 2 | 40 |
| Hong Kong | HK | 45 | 12 | 26.7 |
| Hungary | HU | 2 | 0 | 0 |
| India | IN | 126 | 15 | 11.9 |
| Iran | IR | 8 | 1 | 12.5 |
| Ireland | IE | 19 | 6 | 31.6 |
| Israel | IL | 44 | 18 | 40.9 |
| Italy | IT | 40 | 7 | 17.5 |
| Japan | JP | 104 | 24 | 23.1 |
| Kazakhstan | KZ | 5 | 0 | 0 |
| Macao | MO | 6 | 2 | 33.3 |
| Mexico | MX | 3 | 0 | 0 |
| Netherlands | NL | 25 | 5 | 20 |
| New Zealand | NZ | 3 | 1 | 33.3 |
| Norway | NO | 10 | 1 | 10 |
| Pakistan | PK | 2 | 0 | 0 |
| Peru | PE | 2 | 1 | 50 |
| Poland | PL | 14 | 1 | 7.1 |
| Portugal | PT | 8 | 1 | 12.5 |
| Qatar | QA | 7 | 1 | 14.3 |
| Republic of Korea | KR | 64 | 9 | 14.1 |
| Romania | RO | 6 | 0 | 0 |
| Russian Federation | RU | 12 | 1 | 8.3 |
| Rwanda | RW | 1 | 0 | 0 |
| Saudi Arabia | SA | 2 | 0 | 0 |
| Singapore | SG | 60 | 16 | 26.7 |
| Slovakia | SK | 1 | 0 | 0 |
| Slovenia | SI | 1 | 0 | 0 |
| South Africa | ZA | 2 | 0 | 0 |
| Spain | ES | 22 | 9 | 40.9 |
| Sri Lanka | LK | 2 | 0 | 0 |
| Sweden | SE | 6 | 2 | 33.3 |
| Switzerland | CH | 26 | 5 | 19.2 |
| Taiwan | TW | 39 | 6 | 15.4 |
| Turkey | TR | 4 | 0 | 0 |
| United Arab Emirates | AE | 2 | 1 | 50 |
| United States | US | 1039 | 305 | 29.4 |
| Uruguay | UY | 2 | 0 | 0 |
| Venezuela | VN | 3 | 0 | 0 |
We look forward to “seeing” you in a month in the first virtual ACL ever. Please do not forget to register.